# !pip install -U regdataImports
import regdata as rd
import torch
import matplotlib.pyplot as plt
from matplotlib.animation import FuncAnimation
from matplotlib import rc
import wbml.out as out
from wbml.plot import tweak
from stheno import B, GP, EQ, PseudoObsVFE, PseudoObsFITC
from varz.torch import Vars, minimise_l_bfgs_b, parametrised, Positive
import lab.torchData preperation
# Define points to predict at.
x = B.linspace(0, 10, 100)
x_obs = B.linspace(0, 7, 50_000)
x_ind = B.linspace(0, 10, 20)
# Construct a prior.
f = GP(EQ().periodic(2 * B.pi))
# Sample a true, underlying function and observations.
f_true = B.sin(x)
y_obs = B.sin(x_obs) + B.sqrt(0.5) * B.randn(*x_obs.shape)Plotting function
def plot(method):
if method == 'VFE':
# Plot result.
plt.plot(x, f_true, label="True", style="test")
plt.scatter(
x_obs,
y_obs,
label="Observations",
style="train",
c="tab:green",
alpha=0.35,
)
plt.scatter(
x_ind,
obs.mu(f.measure)[:, 0],
label="Inducing Points",
style="train",
s=20,
)
plt.plot(x, mean, label="Prediction", style="pred")
plt.fill_between(x, lower, upper, style="pred")
tweak()
plt.show()
else:
# Plot result.
plt.plot(x, f_true, label="True", style="test")
plt.scatter(
x_obs,
y_obs,
label="Observations",
style="train",
c="tab:green",
alpha=0.35,
)
plt.scatter(
x_ind,
B.dense(f_post(x_ind).mean),
label="Inducing Points",
style="train",
s=20,
)
plt.plot(x, mean, label="Prediction", style="pred")
plt.fill_between(x, lower, upper, style="pred")
tweak()
plt.show()Sparse regression with Variational Free Energy (VFE) method
# Compute a pseudo-point approximation of the posterior.
obs = PseudoObsVFE(f(x_ind), (f(x_obs, 0.5), y_obs))
# Compute the ELBO.
out.kv("ELBO", obs.elbo(f.measure))
# Compute the approximate posterior.
f_post = f | obs
# Make predictions with the approximate posterior.
mean, lower, upper = f_post(x, 0.5).marginal_credible_bounds()
plot('VFE')ELBO: -5.345e+04
Sparse Regression with Fully Independent Training Conditional (FITC) mehod
# Compute a pseudo-point approximation of the posterior.
obs = PseudoObsFITC(f(x_ind), (f(x_obs, 0.5), y_obs))
# Compute the ELBO.
out.kv("ELBO", obs.elbo(f.measure))
# Compute the approximate posterior.
f_post = f | obs
# Make predictions with the approximate posterior.
mean, lower, upper = f_post(x, 0.5).marginal_credible_bounds()
plot('FITC')ELBO: -5.345e+04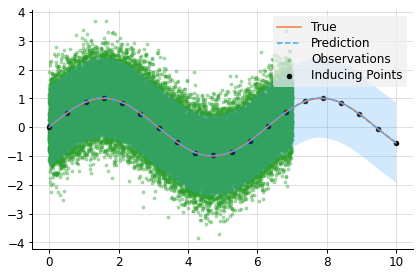
Hyperparameter tuning (Noisy Sine data)
def model(vs):
"""Constuct a model with learnable parameters."""
return vs['variance']*GP(EQ().stretch(vs['length_scale']))torch.manual_seed(123)
dataObj = rd.SineNoisy(scale_X=False, scale_y=False, return_test=True, backend='torch')
x_obs, y_obs, x = dataObj.get_data()plt.scatter(x_obs, y_obs, s=2);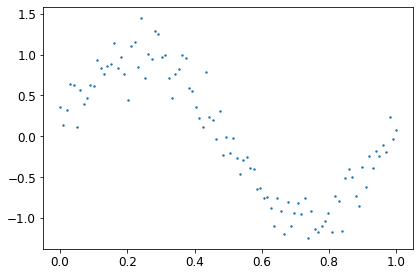
VFE
vs = Vars(torch.float64)
vs.positive(name="noise")
vs.positive(name="length_scale");
vs.positive(name="variance");
vs.positive(init=torch.linspace(0.4,0.6,10), shape=(10,), name='x_ind')
vs.requires_grad(True)
optimizer = torch.optim.Adam(vs.get_latent_vars(), lr=0.1)
fig, ax = plt.subplots(1,2,figsize=(15,5))
losses = []
def update(i):
optimizer.zero_grad()
gp = model(vs)
obs = PseudoObsVFE(gp(vs['x_ind']), (gp(x_obs, vs['noise']), y_obs))
loss = -obs.elbo(gp.measure)
losses.append(loss.item())
loss.backward()
optimizer.step()
gp_post = gp | obs
mean, lower, upper = gp_post(x, vs['noise']).marginal_credible_bounds()
ind_mean = B.dense(gp_post(vs['x_ind']).mean)
ax[0].cla();ax[1].cla();
ax[0].scatter(x_obs, y_obs, s=2)
with torch.no_grad():
ax[0].plot()
ax[0].plot(x, B.dense(mean), label='Prediction')
ax[0].fill_between(x.ravel(), lower, upper, alpha=0.2, label='Uncertainty')
ax[0].plot(x, dataObj.f(x), label='True')
ax[0].scatter(vs['x_ind'], ind_mean, label='Inducing points')
ax[0].set_xlabel('X')
ax[0].legend()
ax[1].plot(losses, label='loss')
ax[1].set_xlabel('Iterations')
ax[1].legend()
anim = FuncAnimation(fig, update, range(50))
rc('animation', html='jshtml')
plt.close()
animFITC
vs = Vars(torch.float64)
vs.positive(name="noise")
vs.positive(name="length_scale");
vs.positive(name="variance");
vs.positive(init=torch.linspace(0.4,0.6,10), shape=(10,), name='x_ind')
vs.requires_grad(True)
optimizer = torch.optim.Adam(vs.get_latent_vars(), lr=0.1)
fig, ax = plt.subplots(1,2,figsize=(15,5))
losses = []
def update(i):
optimizer.zero_grad()
gp = model(vs)
obs = PseudoObsFITC(gp(vs['x_ind']), (gp(x_obs, vs['noise']), y_obs))
loss = -obs.elbo(gp.measure)
losses.append(loss.item())
loss.backward()
optimizer.step()
gp_post = gp | obs
mean, lower, upper = gp_post(x, vs['noise']).marginal_credible_bounds()
ind_mean = B.dense(gp_post(vs['x_ind']).mean)
ax[0].cla();ax[1].cla();
ax[0].scatter(x_obs, y_obs, s=2)
with torch.no_grad():
ax[0].plot()
ax[0].plot(x, B.dense(mean), label='Prediction')
ax[0].fill_between(x.ravel(), lower, upper, alpha=0.2, label='Uncertainty')
ax[0].plot(x, dataObj.f(x), label='True')
ax[0].scatter(vs['x_ind'], ind_mean, label='Inducing points')
ax[0].set_xlabel('X')
ax[0].legend()
ax[1].plot(losses, label='loss')
ax[1].set_xlabel('Iterations')
ax[1].legend()
anim = FuncAnimation(fig, update, range(50))
rc('animation', html='jshtml')
plt.close()
anim